About the Project 🔰
In this project, I have built and compared various Machine Learning Classification models to predict the diagnosis of Alzheimer's Disease and also performed Exploratory Data Analysis which gives insight about all the features present in the data. This project is built using Alzheimers Disease Dataset. You can also visit this notebook at Kaggle. The entire project is built using Python programming language.
Python Libraries Used 📚
- Pandas
- MatplotLib/Seaborn
- Scikit-Learn
Project Workflow
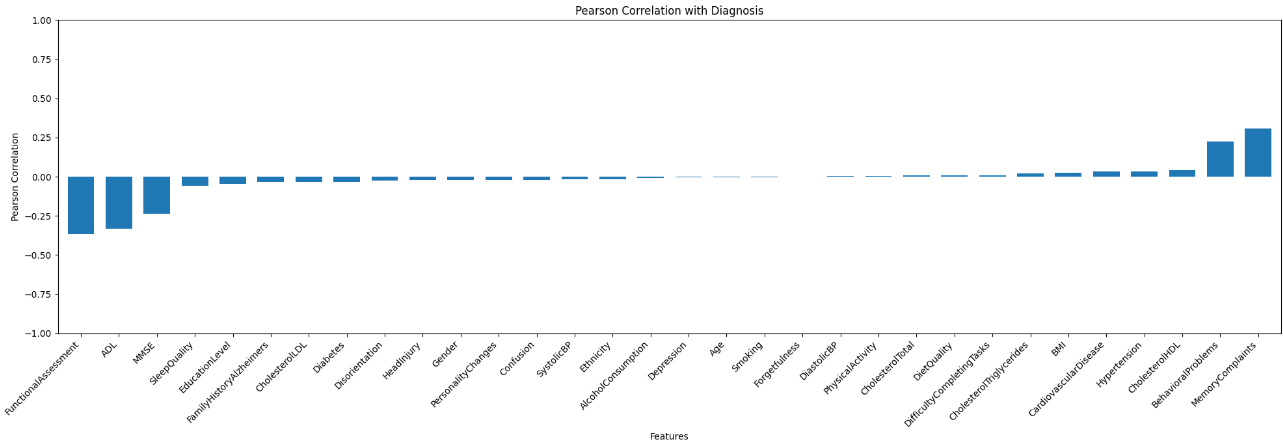
The first step involves the EDA to have insights about the features and find out which features actually significantly contribute to the target variable. In this dataset, there is no correlation among the features which makes the part of Feature Engineering easier.
Important Insights from the Project:
-
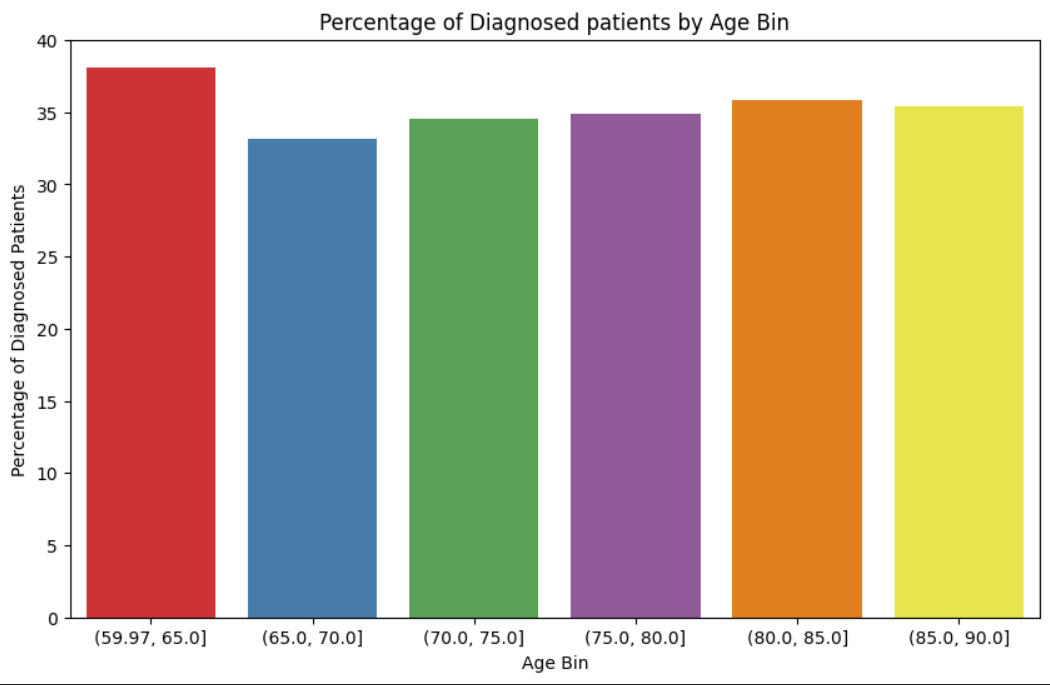
Age: It is medically proven that the risk of Alzheimer's increases with Age. However, from the data it is observed that there is no correlation with age as there are equal percentages of cases from the age of 60 - 90 years.
-
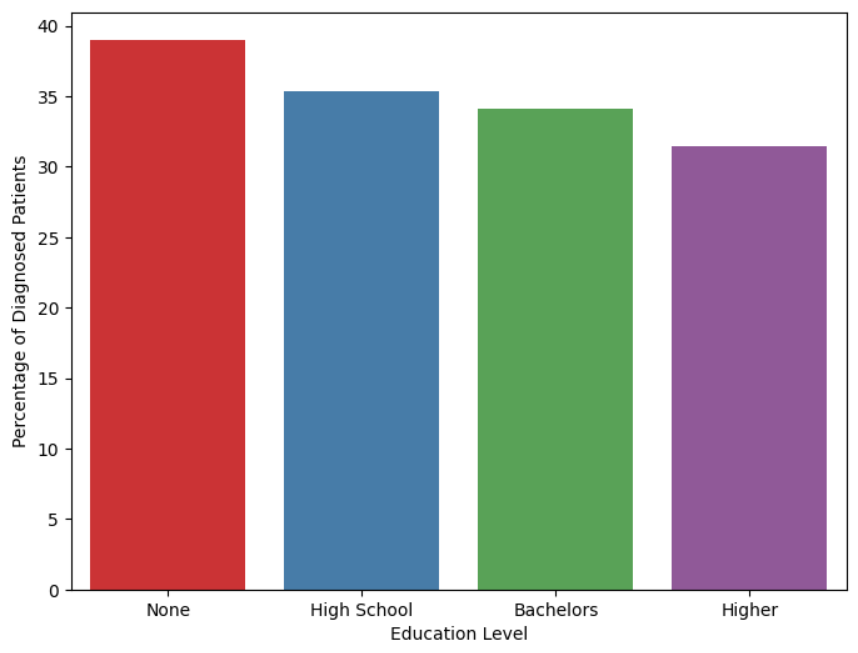
Education Level: The education level of the patient does not play a significant role in the diagnosis of Alzheimer's. It is observed that patients who have no formal education, there are about 38% that are diagnosed. In the case of patients with higher education, there are about 33% cases.
-
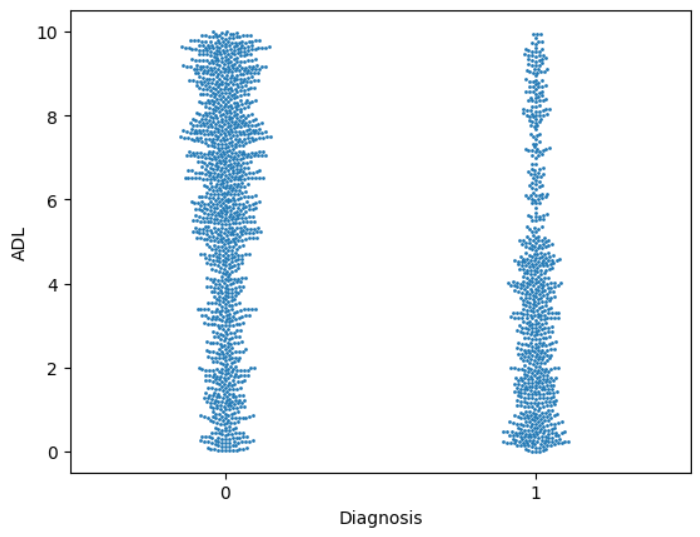
Cognitive Assessments: It is possible to predict diagnosis only on the basis of Cognitive Assessments, irrespective of the lifestyle and medical history of the patient. Lifestyle factors and medical history features showed no contribution.
Pearson Correlation Plot for Diagnosis:
Models And Evaluation:
First of all, the data was split into train and test data to build the model. Since this is a skewed classification problem, metrics such as confusion matrix, precision, and recall are used to evaluate the models. The aim is to have the precision of the model as high as possible since false negatives imply missed patients who actually require diagnosis but are missed by the model.
Precision: \( \frac{\text{True Positives}}{\text{True Positives} + \text{False Negatives}} \)
| Serial No. | Model | Precision |
|---|---|---|
| 1 | Logistic Regression | 0.85 |
| 2 | Decision Tree | 0.95 |
| 3 | Random Forest | 0.96 |
| 4 | Gradient Boost | 0.96 |
Contributing 🤝
In case you are interested in contributing and collaborating on this project, please do contact me on LinkedIn.
License 📃
This Notebook has been released under the Apache 2.0 open-source license.